
Understanding the Bode Plot in servo system control
Gerard Bush, engineer at INMOCO, explains how the Bode Plot remains essential for tuning and diagnosing servo systems despite modern auto-tuning technologies.
www.inmoco.co.uk
In servo systems, optimising performance factors such as gain and phase shift is critical to achieving precise control. While modern microprocessors can tune servo drives and motors to balance control attributes, using the traditional approach to understand servo system behaviour across frequencies can be vital. The Bode Plot enables fine tuning of complex servo systems and it can also enhance diagnostics.
In the control of a servo system, comprising a servo motor and servo drive, the critical factors to enable its measurement and control include the gain plot and the phase shift plot. The former shows how much the system amplifies or reduces an input signal at different frequencies; the latter explains how much the output lags or leads the input signal. Expressed within the framework of frequency, i.e. the speed of oscillation, these plots are known today after their inventor Hendrik Bode, an engineer at Bell Labs in the U.S., who made his discovery in the 1930s.
The purpose of a Bode Plot within servo control is to check accuracy at low speed and ensure stability at high speed. Crucially, the plot is also used to prevent oscillations and instability while optimising the speed of response to the input signal. To achieve this, a Bode Plot can tell us how far gain can be increased, and phase shifted, before instability is reached. It can also tell us the crossover frequency, where the system transitions from stable to unstable behaviour.
The relevance of a Bode Plot
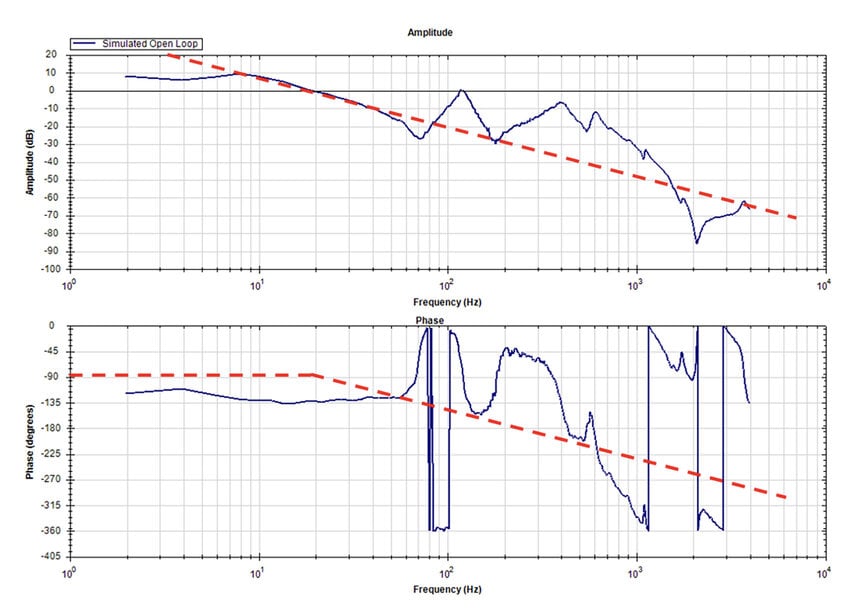
To achieve a Bode Plot, measurements of amplitude (dB) and phase (degrees) are plotted on a logarithmic scale across a tested frequency range. Today, while powerful microprocessors within digital drives can replace the need for calculations, understanding what a Bode Plot shows can still be crucial for designing, tuning, and troubleshooting a servo system.

Kollmorgen AKM2G servo motors and AKD2G drives.
This tried and tested approach can help an engineer understand the performance they need, and what is possible, including the response rate balanced against instability, as well as the level of movement precision. A Bode Plot can also assist with the diagnosis of discrepancies in motion performance, and it can be particularly useful when customising a servo system for application requirements.
What a Bode Plot reveals
Specifically, from the key factors revealed from the Bode Plot, it’s possible to gauge the system’s bandwidth, relating directly to its productivity potential. The bandwidth indicates the settling time of the mechanism, meaning the higher the bandwidth, the faster the time to settle to a commanded speed or position. The Bode Plot also confirms system stability, showing whether it can operate smoothly during motion or at rest. Phase and gain margins are useful indicators of system stability, where the larger the margins, the more stable the system.
In motion system design, the resonant frequencies linked to the mechanical compliance throughout the system must also be considered. Each mechanical element of a system, such as the motor or gears, has its own natural resonance frequency, including both an anti-resonance and a resonance point. The system element with the lowest frequency is the most critical as a bandwidth higher than this level cannot be achieved. Using a Bode Plot to understand the resonant points helps understand how the system can be optimised through system tuning.

Servo Systems, Kollmorgen 2G Motion System significantly enhances torque and responsiveness, improve operator safety, easy installation.
The Bode Plot can also show the load to inertia ratio magnitude. The difference in frequency between the first point of anti-resonance to the first point of resonance is proportional to the inertia ratio: the higher the difference, the greater the load-to-motor inertia ratio. The stiffness and load-to-motor inertia relationship is critical because it directly impacts the system’s ability to respond quickly and maintain stability to balance precision and vibration.
Why a Bode Plot is still necessary
The results of the Bode Plot can inform where and how a servo system can be optimised with tuning techniques. Applying a combination of filters, the amplitude and phase values can be changed to improve phase and gain margins, improve bandwidth, or address resonance issues.
Now, intelligent servo drives, such as the Kollmorgen AKD or AKD2G, used in combination with Kollmorgen AKM or AKM2G servo motors, include auto-tuning capabilities that can adjust key parameters, while balancing compensating factors, to optimise performance. As a result, the servo drive can automatically adjust control loops to achieve a balance between speed, accuracy, and stability by measuring how the motor and load respond to commands.
While auto-tuning can simplify the process of balancing gain and phase shift across frequencies, understanding the Bode Plot remains important to fine tune a system, especially for complex applications, and it can also speed up diagnostic challenges. Whether intelligent drives can take on the mathematical heavy lifting, or if Bode Plots are required, INMOCO can help design engineers develop a servo system to achieve the performance that the application requires.
www.inmoco.com