www.industryemea.com
08
'22
Written on Modified on
Rail track monitoring – Real time geometry and defects measuremen
Follow your track geometry and defects.

Railway tracks are permanently subject to numerous constraints, which can be weather conditions (thermal amplitude depending on the season, etc.), the stability of the ground (natural movements, seismic activity, etc.) or wear and tear linked to their use (passage of trains, etc.). Playing a key role in reducing carbon gases in transport, and driven by the will and ambition of the public authorities, the railway network must also be able to manage increasing demands for capacity and availability (both for passengers and freight).
The monitoring of “track geometry”, i.e. rail deformations, is therefore a major challenge for both infrastructure managers and network operators. It is in fact a question of guaranteeing smooth running on the track, not only for passenger comfort but also – and above all! – for safety reasons.
A challenge: to overcome the incompatible triangle of “cost – exhaustiveness – immediacy”
Currently, this rail track geometry monitoring is mainly carried out by inspection rounds, which can be visual and/or done with instruments. These rounds are costly, both in terms of time and equipment, especially as it is sometimes necessary to immobilize all or part of the rail traffic.
Detecting defects is therefore limited – firstly, because the prohibitive cost of the rounds means that only certain portions of track are inspected daily (with no direct logic between the monitoring and potential defects); secondly, because it is not possible to follow up on the apparition or the development of the deterioration of the defects observed between two inspections.
An idea: take advantage of ordinary journeys to observe and evaluate first-hand the state of the network
This solution takes the aforesaid difficulties into account and puts forward a very simple idea – capitalize on the ordinary rotations of the rolling stock to make it a first-hand witness of the state of the network.
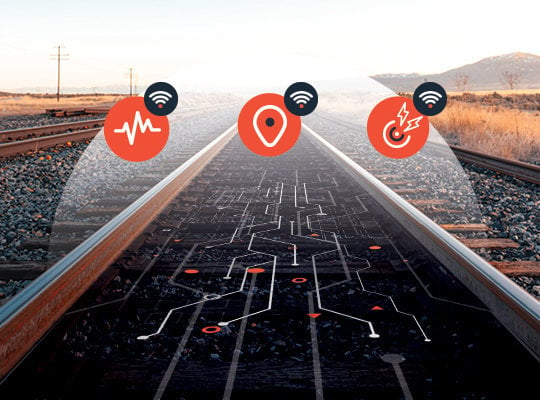
We have therefore developed an end-to-end IoT solution based on:
1. Non-intrusive instrumentation of part of the rolling stock. This involves equipping several “control” trains with our Railnode IoT sensors. Two would be positioned on a bogie (accelerometers) and one placed on the roof of the rolling stock (GPS terminal).
2. Instrumentation, at certain points along the track, with Bluetooth IoT sensors to ensure continuity of GPS tracking in underground zones.
3. The development of algorithms enabling:
- The precise geolocation of potential defects (not all shocks are defects but all defects generate shocks).
- The creation of baselines for each defect and the anticipation of their development.
- Characterization – taking into account the context – of the different types of defects.
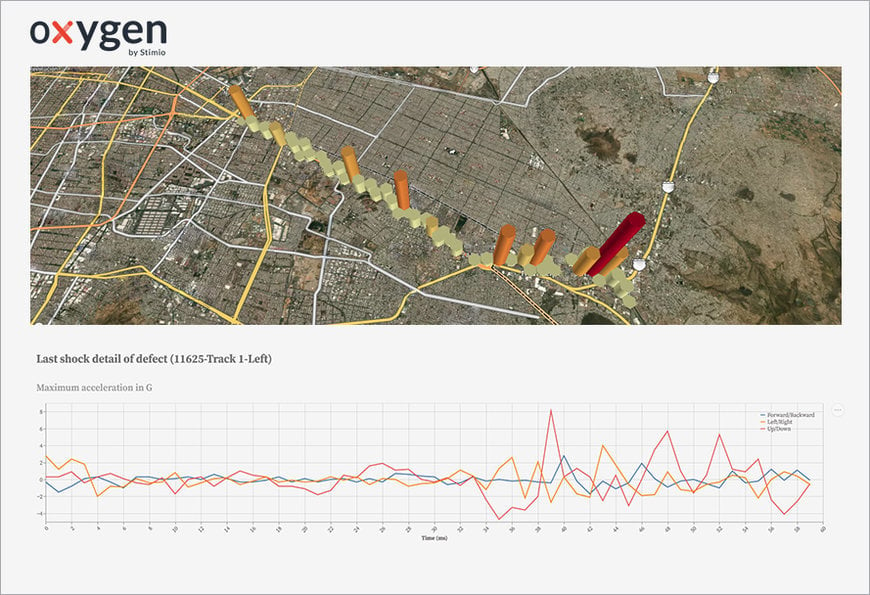
4. Transformation of the data into information available via the Oxygen platform.
A tool: to monitor in real time the position and characteristics of defects on the track
Our tool enables us to deliver immediate, clear and reliable information on network defects and in particular :
– Their location
– Their main characteristics
– Their development over time
– Anticipation of their potential deterioration
– Details of the shocks they have generated
In addition to data visualization, it is a tool which can really help in decision-making and can lead to maintenance prescriptions, particularly in the prioritization of the segments on which to intervene.

www.stimio.fr
The monitoring of “track geometry”, i.e. rail deformations, is therefore a major challenge for both infrastructure managers and network operators. It is in fact a question of guaranteeing smooth running on the track, not only for passenger comfort but also – and above all! – for safety reasons.
A challenge: to overcome the incompatible triangle of “cost – exhaustiveness – immediacy”
Currently, this rail track geometry monitoring is mainly carried out by inspection rounds, which can be visual and/or done with instruments. These rounds are costly, both in terms of time and equipment, especially as it is sometimes necessary to immobilize all or part of the rail traffic.
Detecting defects is therefore limited – firstly, because the prohibitive cost of the rounds means that only certain portions of track are inspected daily (with no direct logic between the monitoring and potential defects); secondly, because it is not possible to follow up on the apparition or the development of the deterioration of the defects observed between two inspections.
An idea: take advantage of ordinary journeys to observe and evaluate first-hand the state of the network
This solution takes the aforesaid difficulties into account and puts forward a very simple idea – capitalize on the ordinary rotations of the rolling stock to make it a first-hand witness of the state of the network.
We have therefore developed an end-to-end IoT solution based on:
1. Non-intrusive instrumentation of part of the rolling stock. This involves equipping several “control” trains with our Railnode IoT sensors. Two would be positioned on a bogie (accelerometers) and one placed on the roof of the rolling stock (GPS terminal).
2. Instrumentation, at certain points along the track, with Bluetooth IoT sensors to ensure continuity of GPS tracking in underground zones.
3. The development of algorithms enabling:
- The precise geolocation of potential defects (not all shocks are defects but all defects generate shocks).
- The creation of baselines for each defect and the anticipation of their development.
- Characterization – taking into account the context – of the different types of defects.
4. Transformation of the data into information available via the Oxygen platform.
A tool: to monitor in real time the position and characteristics of defects on the track
Our tool enables us to deliver immediate, clear and reliable information on network defects and in particular :
– Their location
– Their main characteristics
– Their development over time
– Anticipation of their potential deterioration
– Details of the shocks they have generated
In addition to data visualization, it is a tool which can really help in decision-making and can lead to maintenance prescriptions, particularly in the prioritization of the segments on which to intervene.

www.stimio.fr

